Tour of the UI
cereyan serve opens the UI at http://127.0.0.1:4200. It is built for a desktop browser and updates live from the server's event stream. One top bar carries everything that is not a page: the eight sections (Dashboard, Runs, Flows, Events, Artifacts, Rules, Variables, and Settings), a Project switcher that scopes every list to one project, a search box (or ⌘K, Ctrl+K elsewhere) that jumps to a section, a flow, a run by name, or an artifact by key, the connection indicator that reads live while the stream is connected, and the theme toggle.
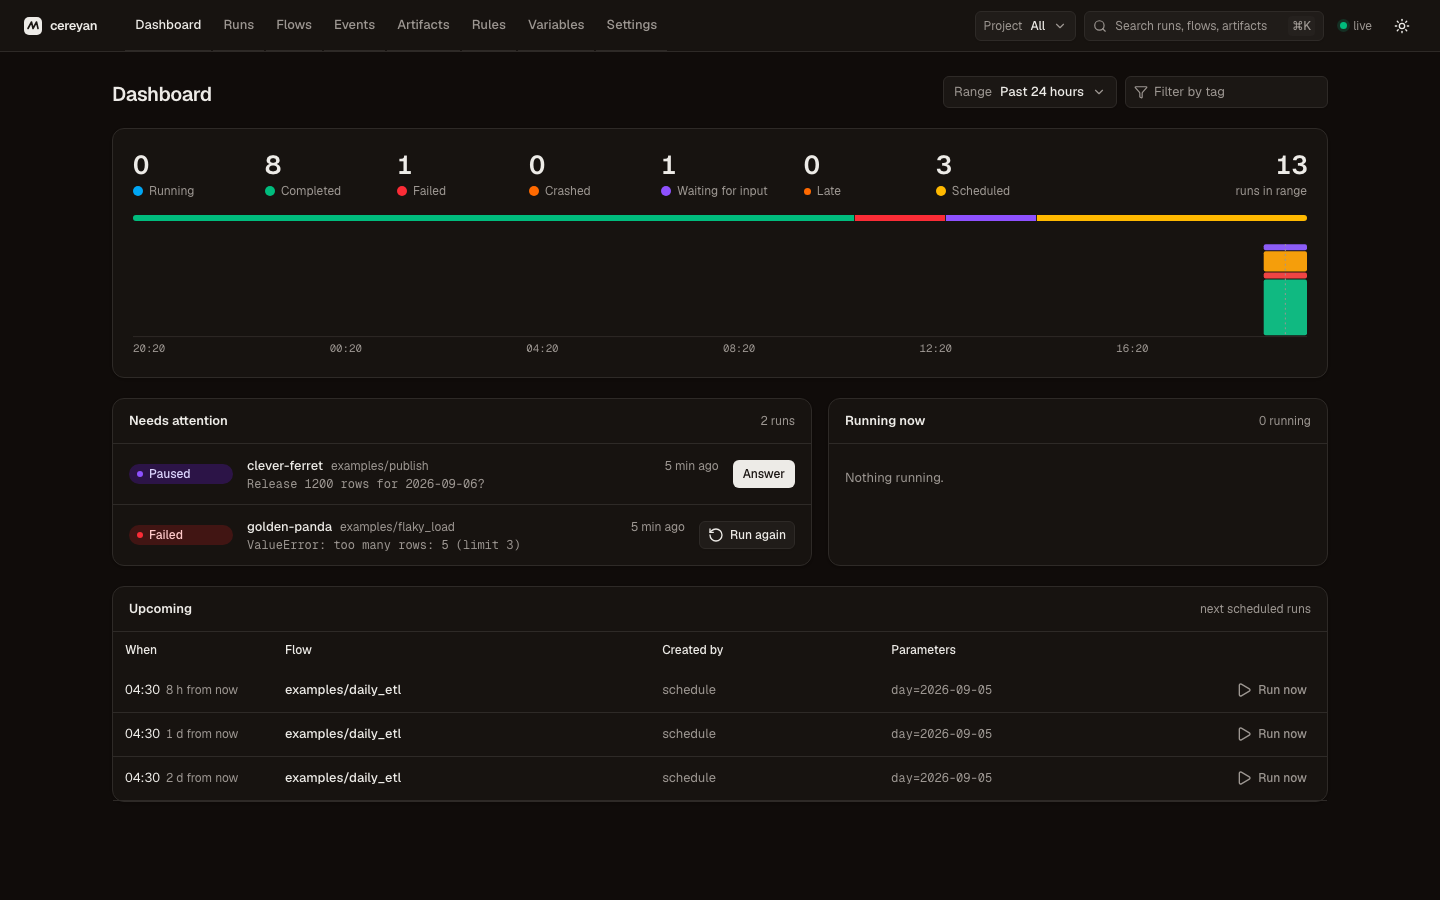
The palette is a warm neutral in light and dark. Ink is the only brand colour; every other colour on a page belongs to a run state, so a glance tells you what is running, failed, waiting, or late.
Dashboard
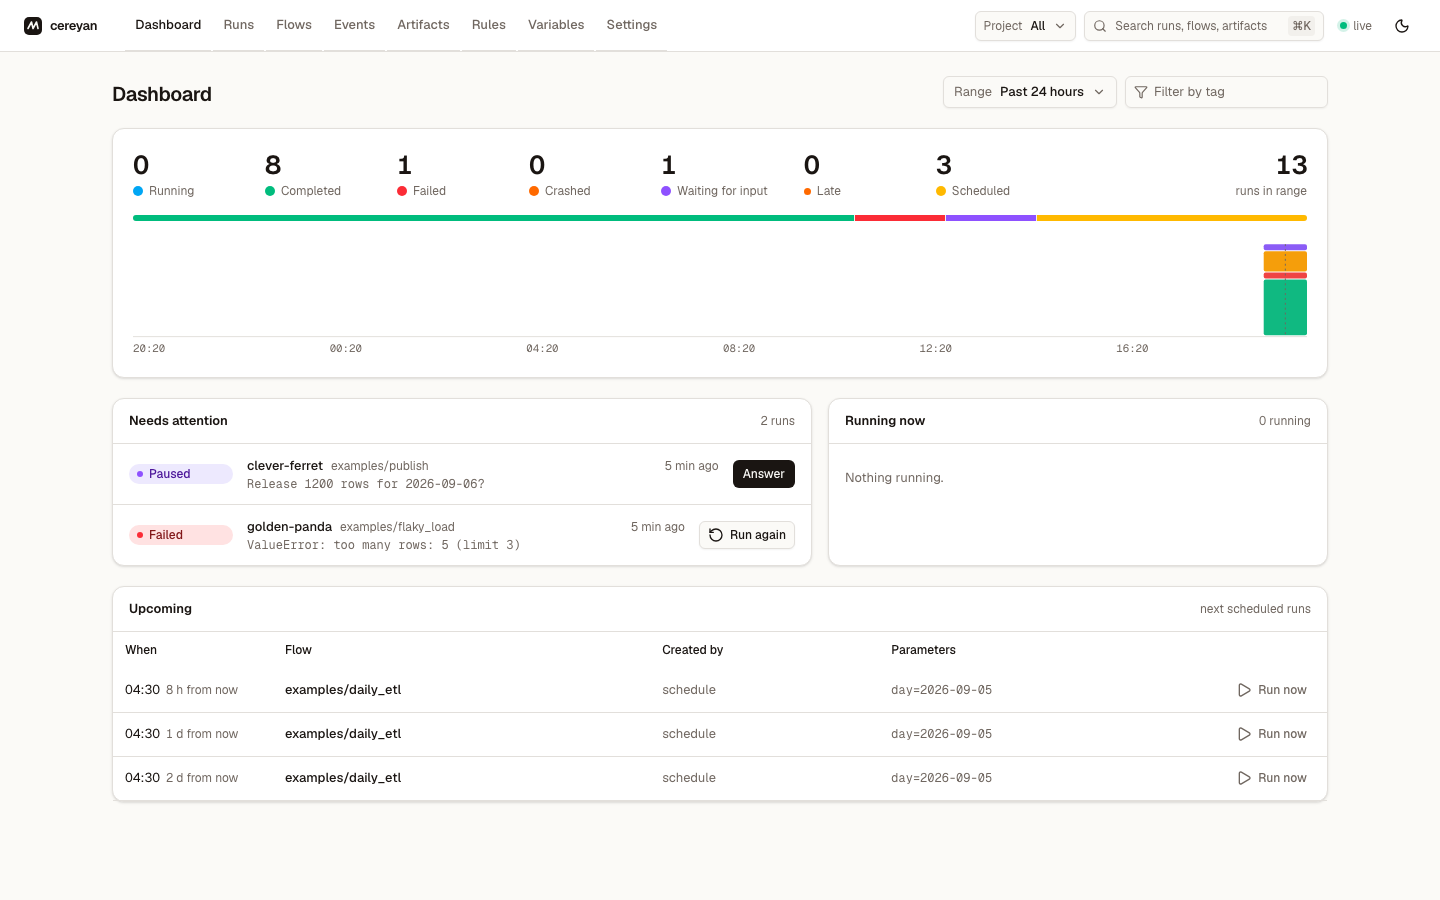
Counts for the selected range (Running, Completed, Failed, Crashed, Waiting for input, Late, Scheduled) with a proportion bar and an hourly histogram by state. Needs attention lists the runs waiting on you: paused runs with their question and an Answer button, failed runs with Run again, crashed and late runs with Open. Running now shows each active run with its elapsed time and how many of its tasks are done. Upcoming lists the next scheduled runs with a Run now shortcut. The range selector and the tag filter apply to the whole page.
Runs
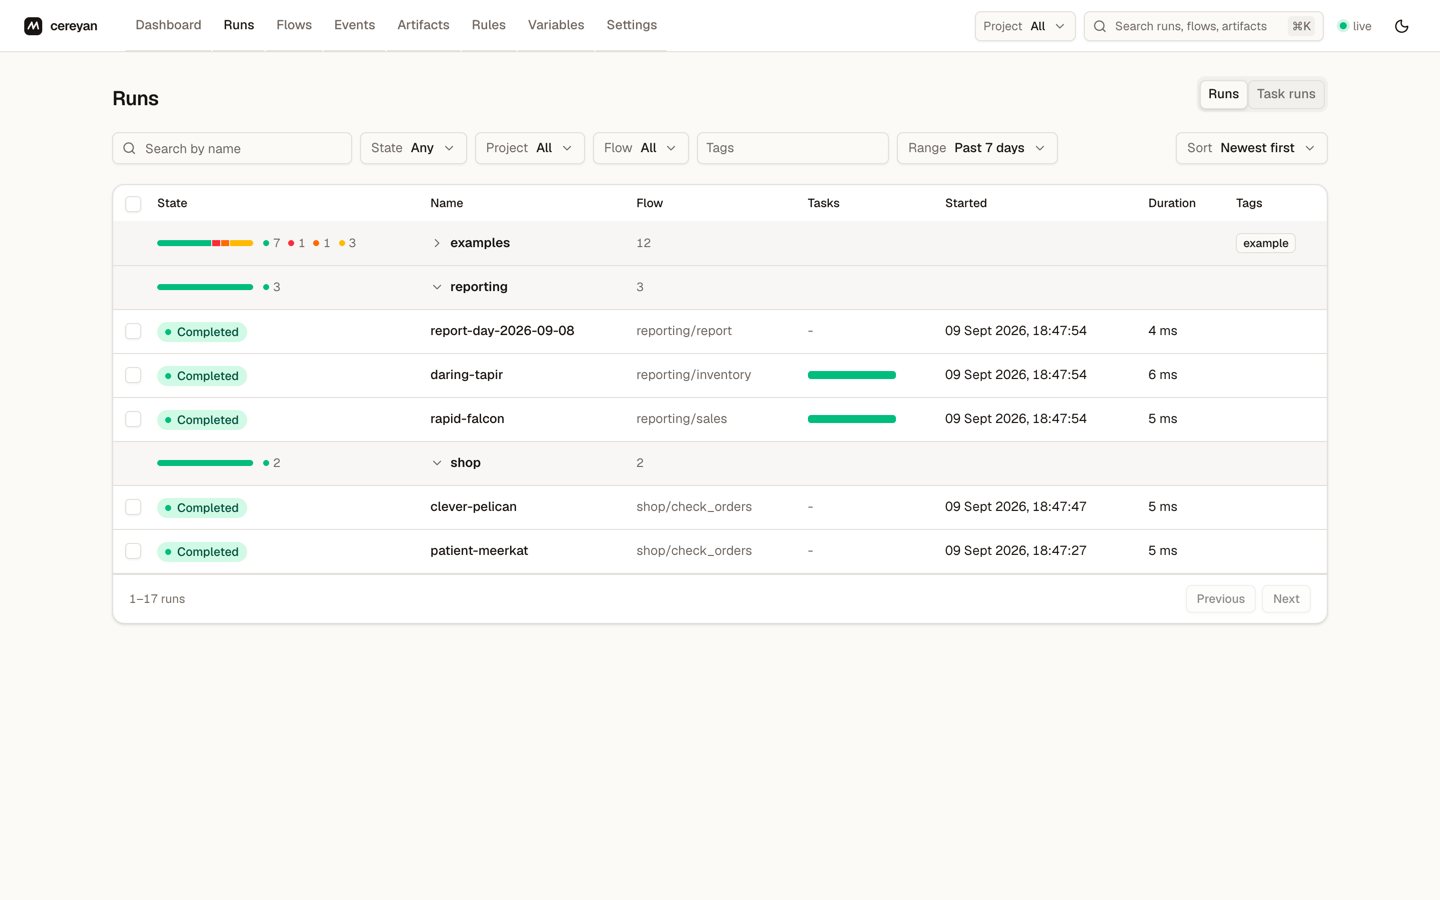
Every run, newest first, in collapsible groups by the flow's group. Filters are popover buttons for state, project, flow, tags, and range, plus a name search and a sort. The Tasks column is a bar of the run's task runs by state. The Task runs tab lists task runs across runs the same way. Selecting rows raises a bar at the bottom of the window with Cancel and Delete for the selection; a selection may span groups.
Run detail
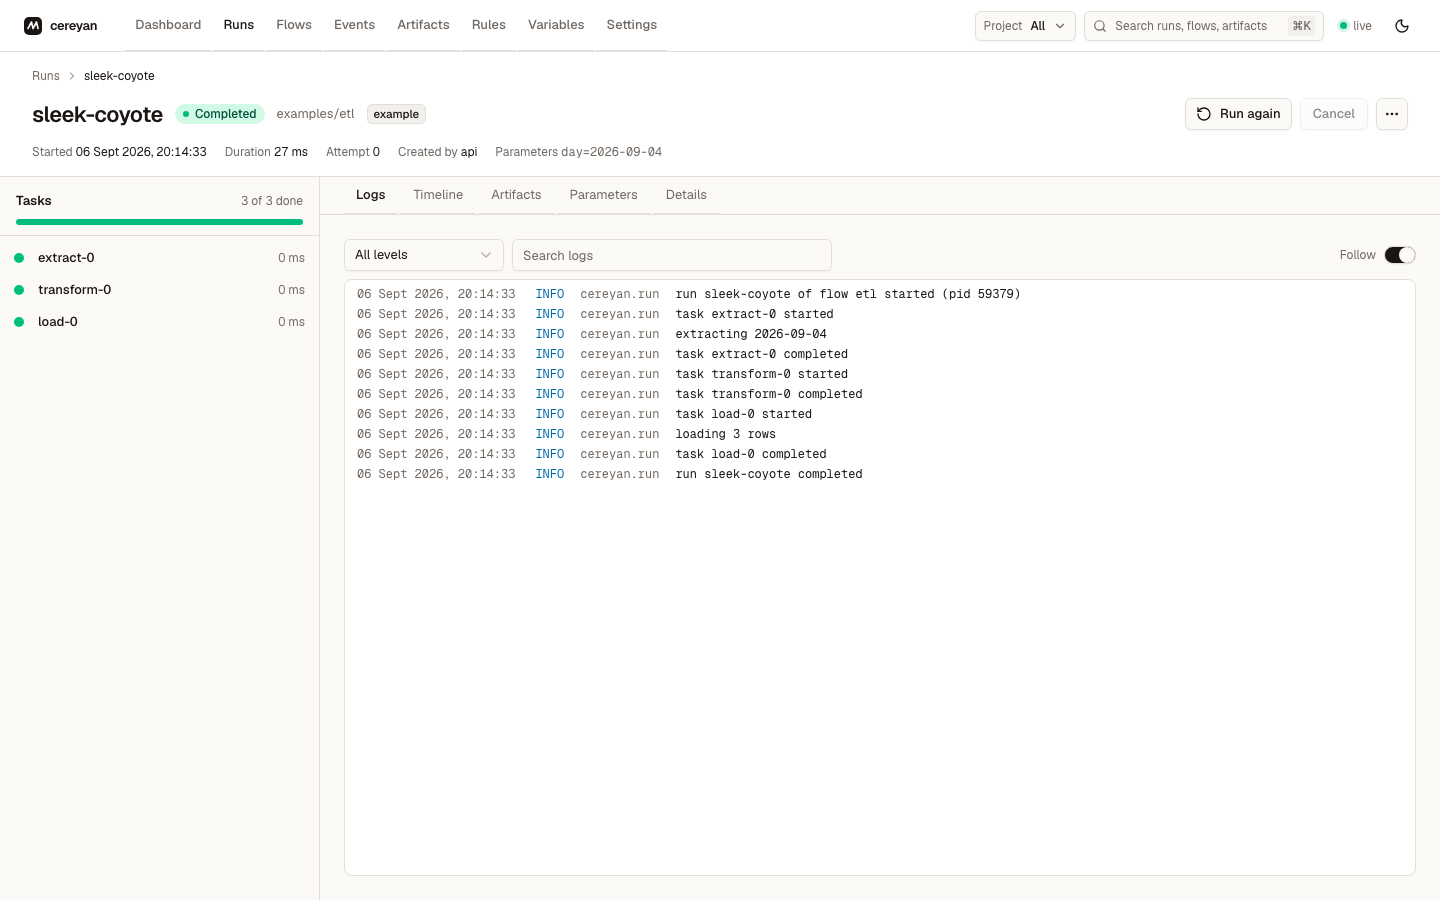
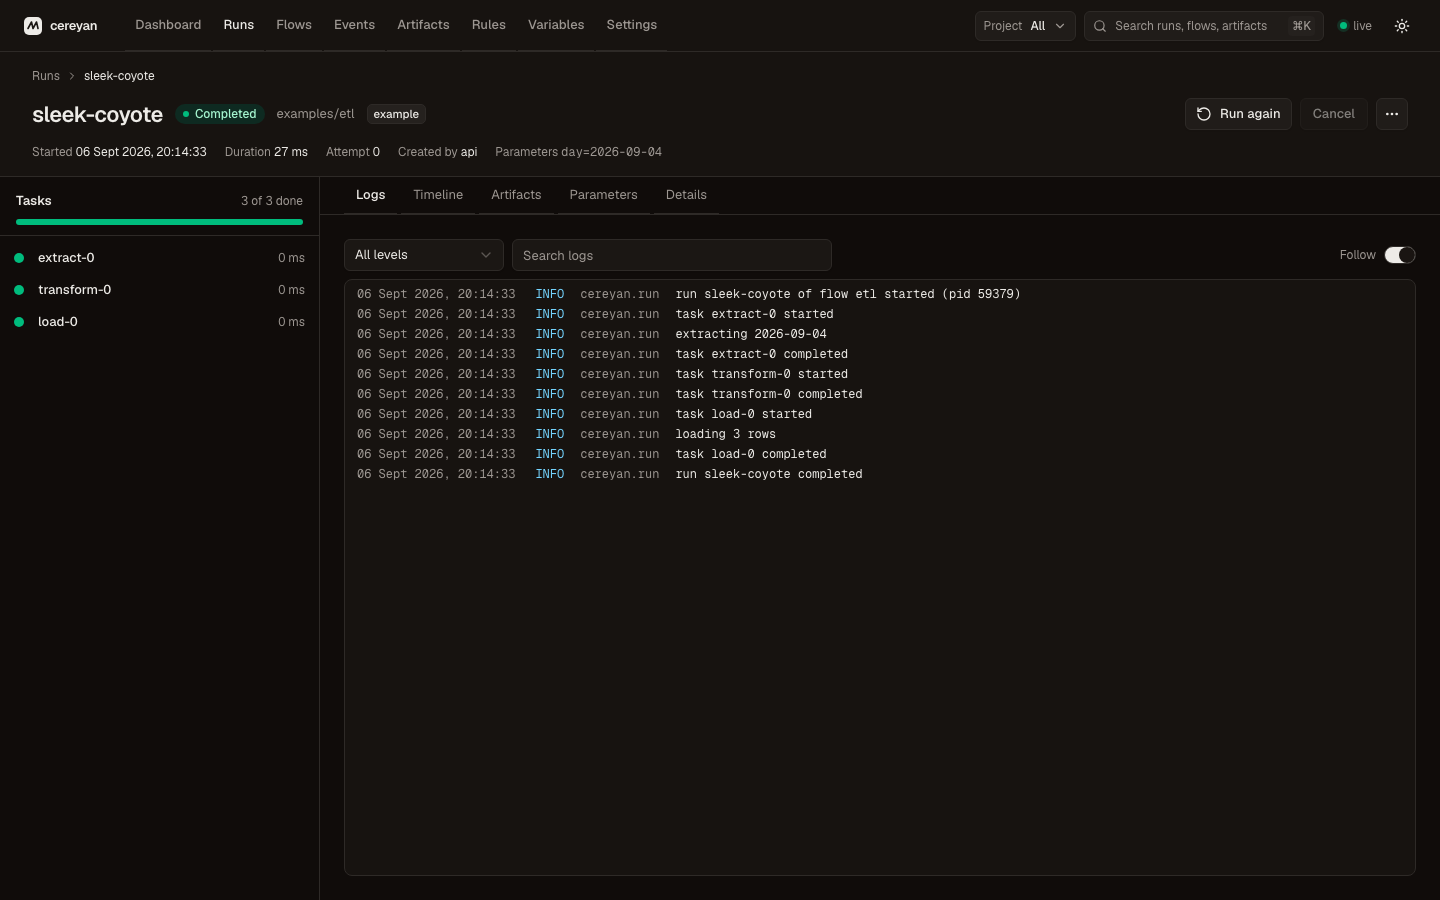
The header band shows the run's name, state, flow, tags, and a line with its start, elapsed or total time, attempt, what created it, and its parameters. Run again and Cancel sit on the right; Delete is in the overflow menu. A paused run shows its question and the Resume form in the band.
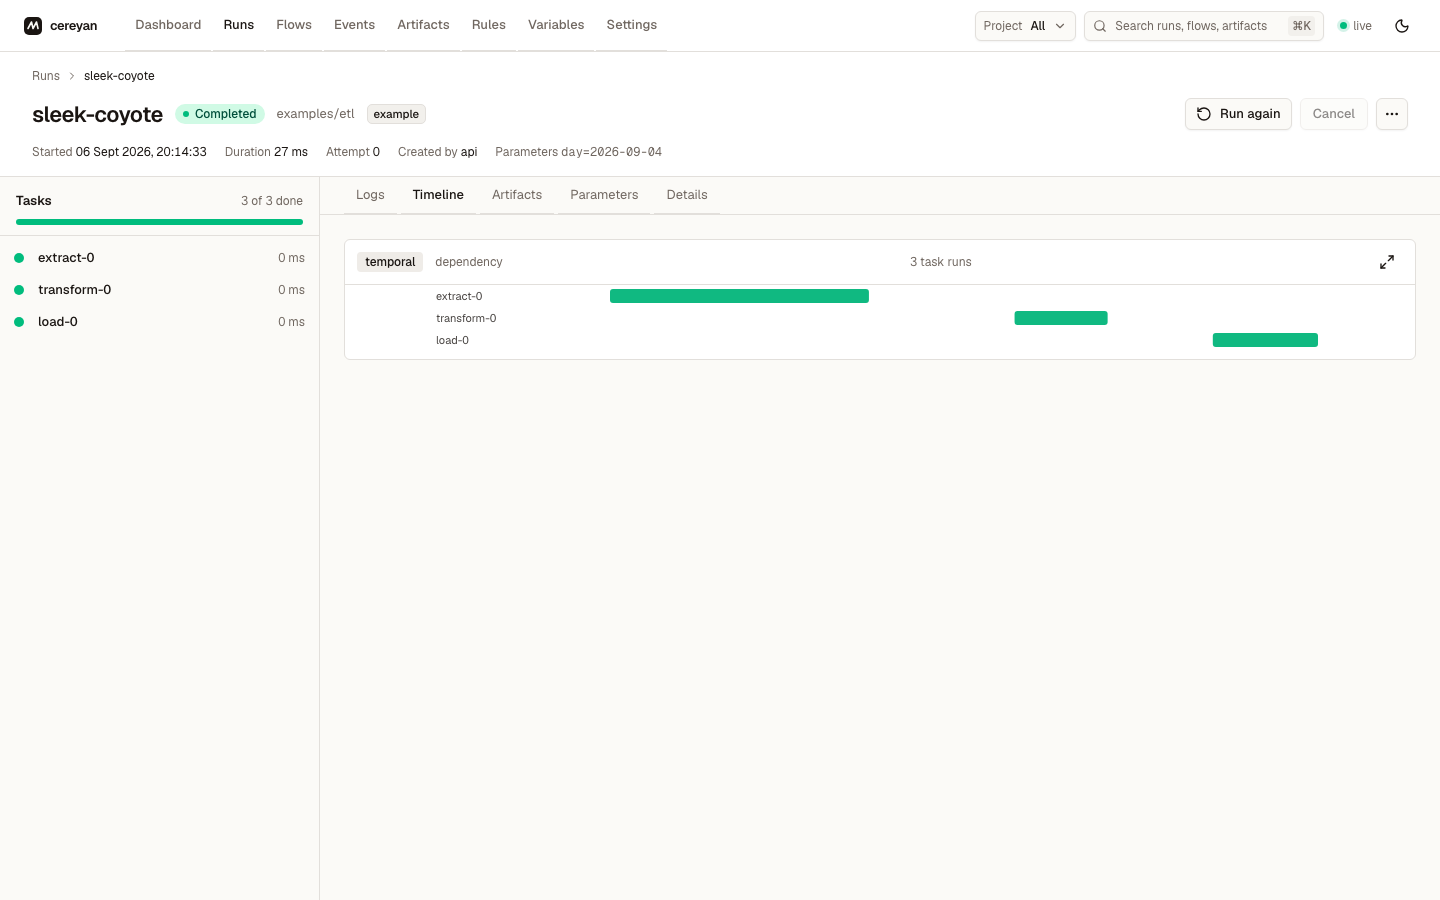
The tasks rail on the left lists every task run with its state, duration, and, for a task waiting to retry, the attempt and a countdown. Click a task to focus it: the Logs tab then shows only that task run's lines, with a chip you can clear. A task run also has a page of its own, opened from the Task runs tab of the runs page or from a bar on the Timeline, carrying its logs, artifacts, and details. The tabs on the right:
- Logs: log lines with a level filter, a search box, and Follow to keep the newest line in view while the run executes.
- Timeline: the task runs on a time axis, and a dependency view of the same graph.
- Artifacts: markdown, tables, progress bars, links, and images the run published.
- Parameters: the values the run was called with.
- Details: ids, timing, what created the run, its scheduled time, priority, attempt, the previous attempt, failure and crash counts, and the engine PID.
Flows
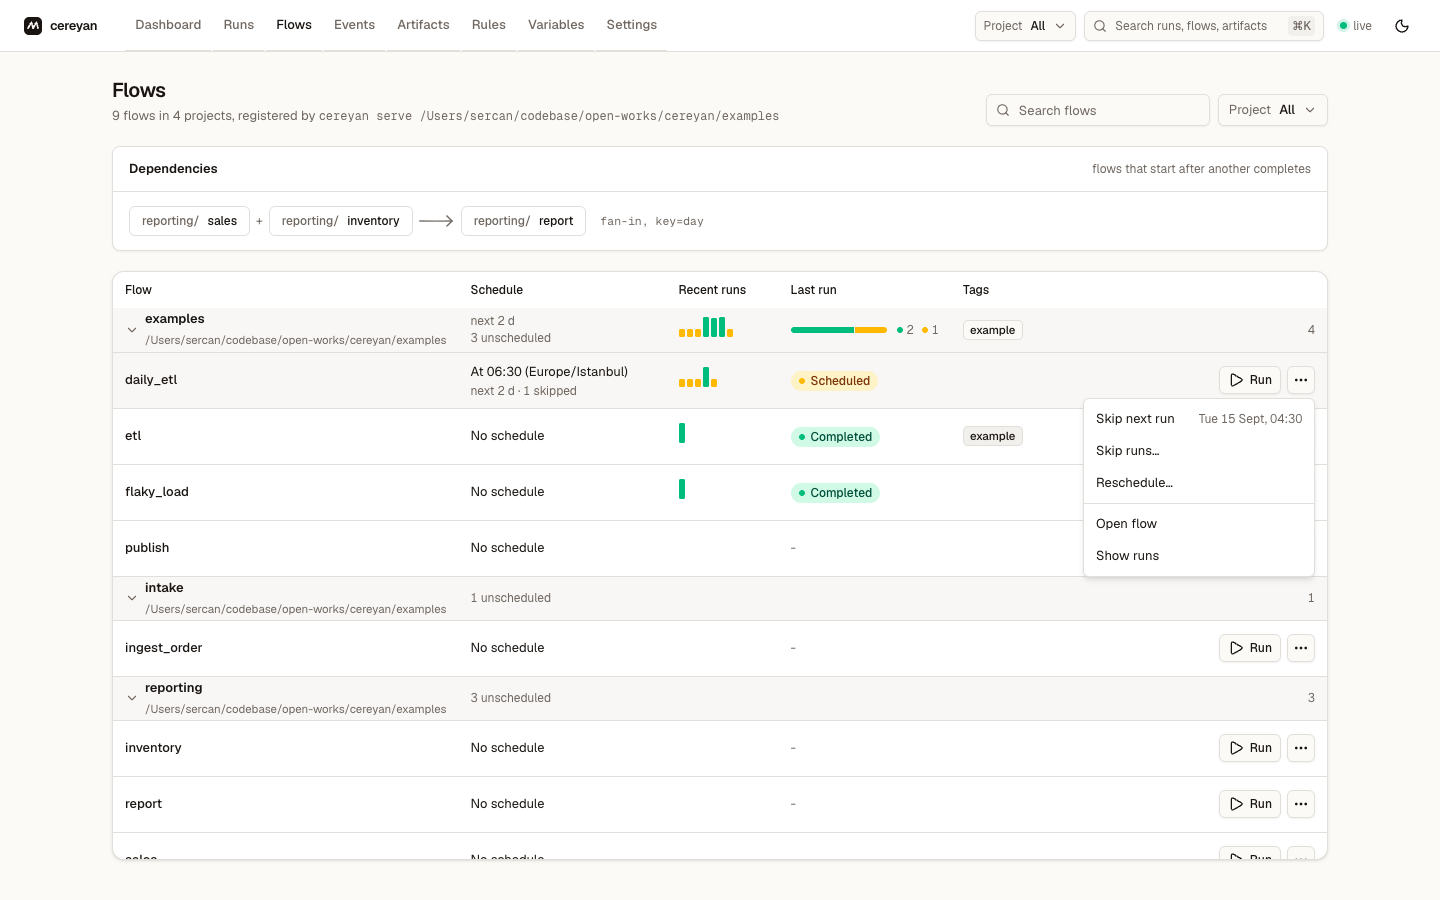
Every flow the server has registered, in collapsible groups. A flow's group is the one it declared with group=, else its project; a group of one project shows that project's source directory, and a group spanning several names them. Each row shows the schedule in words with the next fire time, the last ten runs as bars coloured by state and sized by duration, the last run's state, and tags. Run opens a form built from the flow's parameter schema. For a scheduled flow the row menu adds Skip next run (with the time it skips), Skip runs…, and Reschedule…, and the schedule cell counts skipped fires beside the next one. The Dependencies panel above the table draws each after= chain as nodes joined by arrows and each fan-in as its upstreams joined into the downstream flow with its key. A flow the running server did not register stays listed, dimmed, with its last-seen time and a Delete action.
A group header is the same columns rolled up, so collapsing a group hides the detail without hiding what it says: the soonest next fire, the group's recent runs, its last-run states as a bar with counts, the union of its tags, and how many flows it holds. Flows the running server no longer has registered are counted separately as stale, so an all-green bar cannot hide them. A group of more than five rows starts collapsed and everything else starts open; a lone group is always open, and a search opens every group it matches.
Flow detail
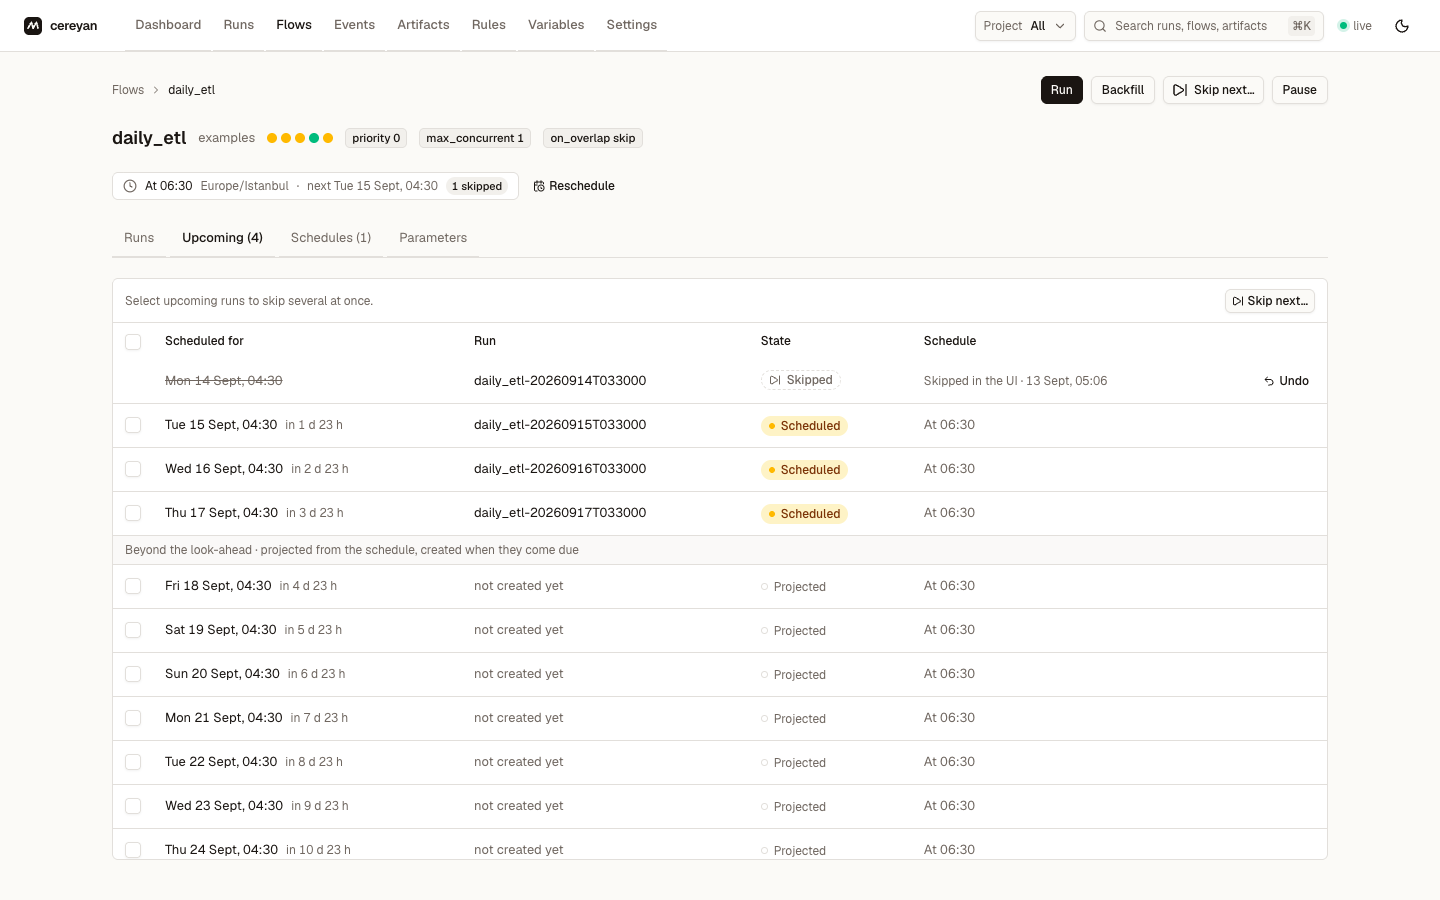
The flow's description (rendered from its docstring), its schedule summary with the next fire that will run and how many are skipped, chips for priority, concurrency cap, and overlap policy, the last ten runs as dots, and Run, Backfill, Skip next…, and Pause actions, with Reschedule beside the schedule summary. Tabs list the runs; the upcoming runs, each with how far off it is and Skip or Undo, a skipped one saying who skipped it and when, several skippable at once or all from the header checkbox, and the fires past the look-ahead listed as projected, ten more at a time; the schedules with an editor and a preview of upcoming fire times; and the parameter schema.
Events
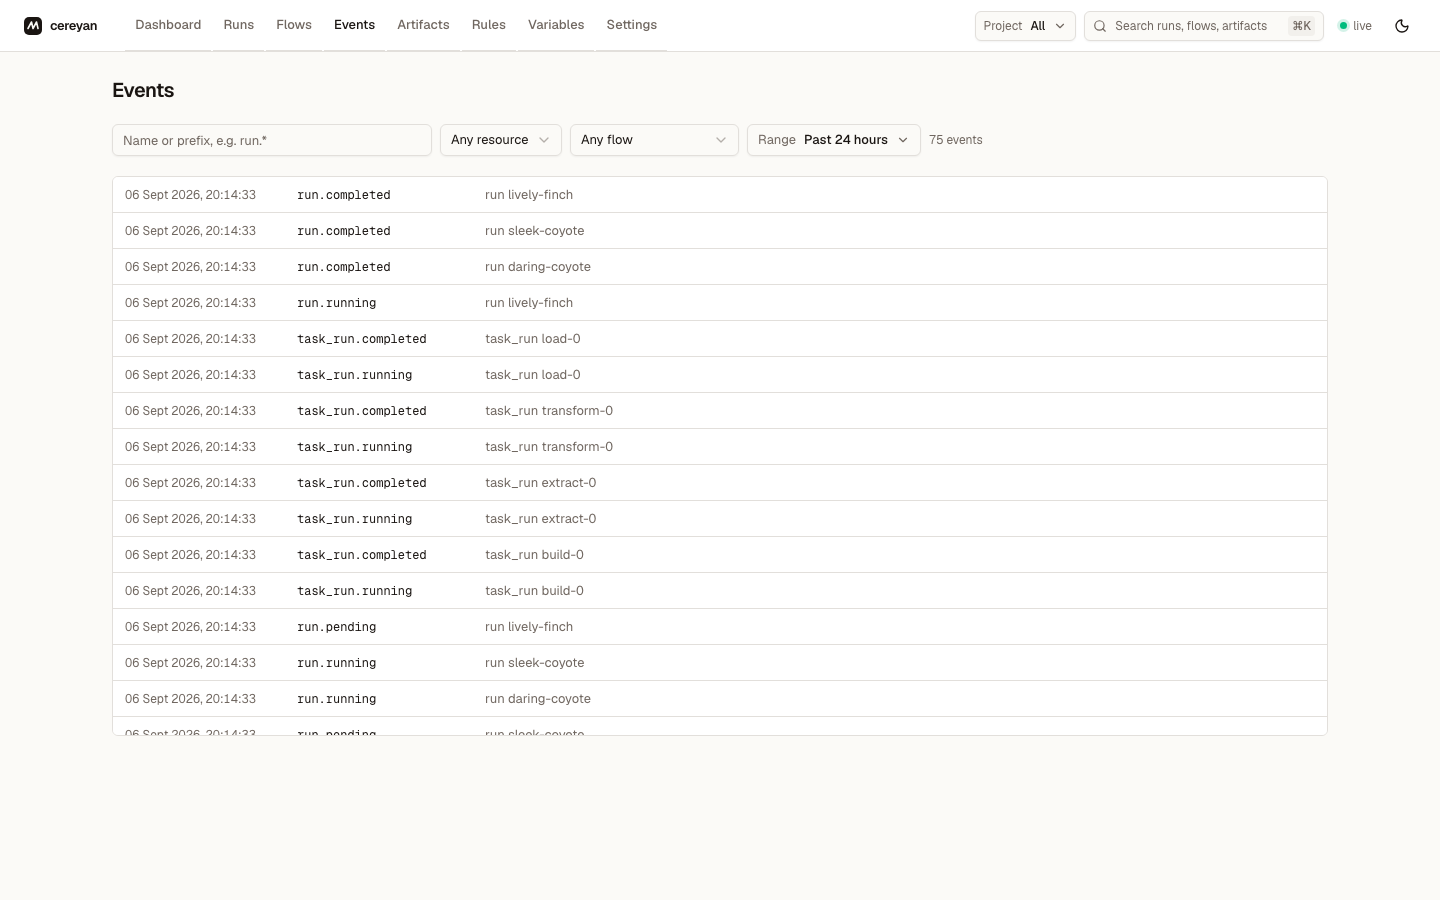
The event feed, newest first, filtered by name or prefix such as run.*, by resource kind, by flow, and by time range. Open an event to see its payload and related resources. New events appear as they happen.
Artifacts
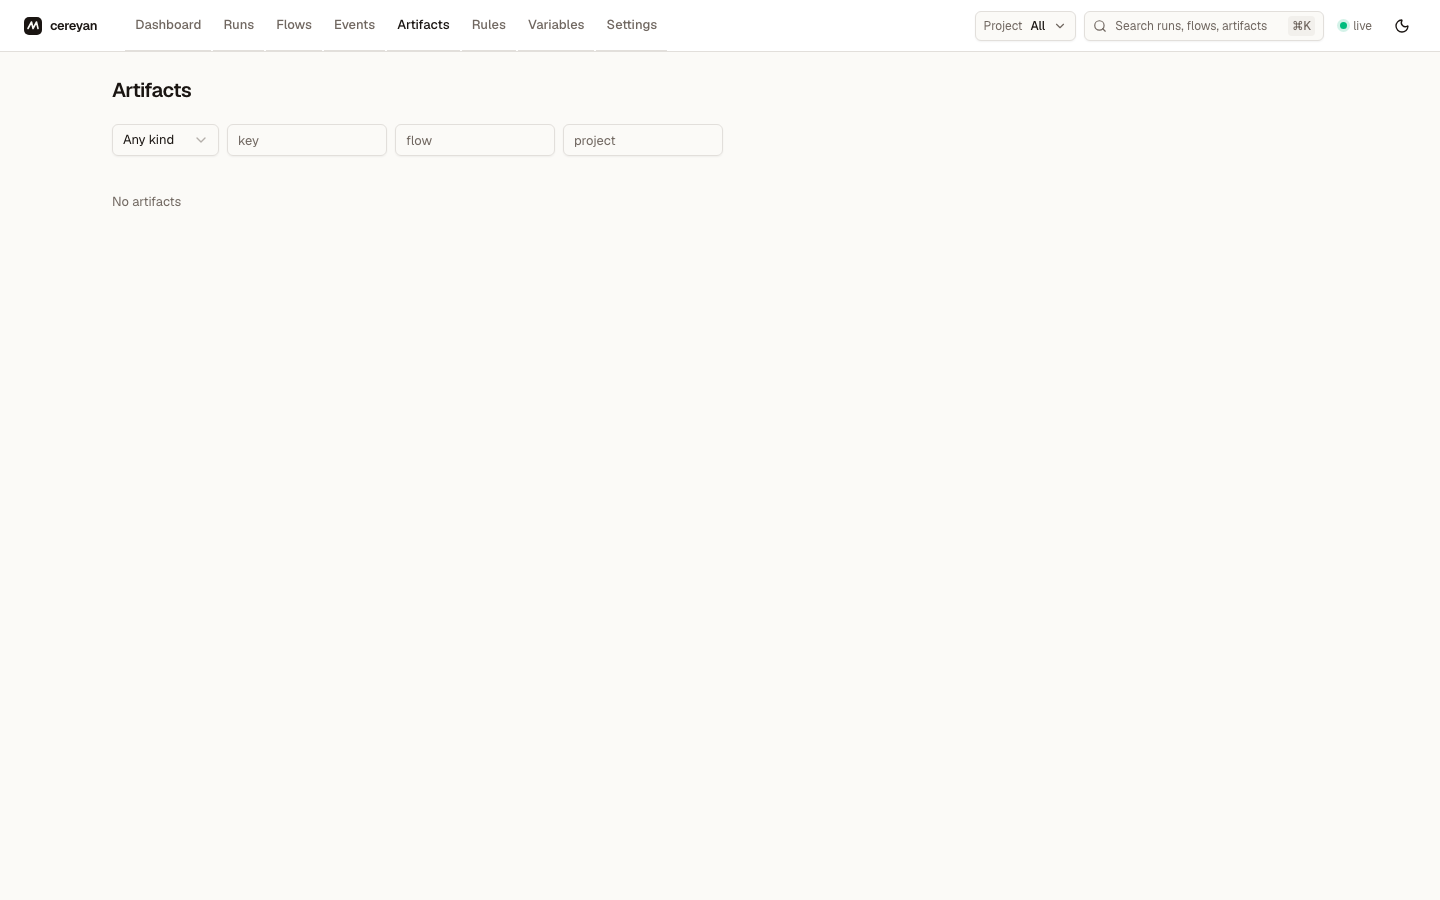
Artifacts across all runs, filtered by kind, key, flow, and project. Open a key to see its history: every value published under that key across runs, newest first.
Rules
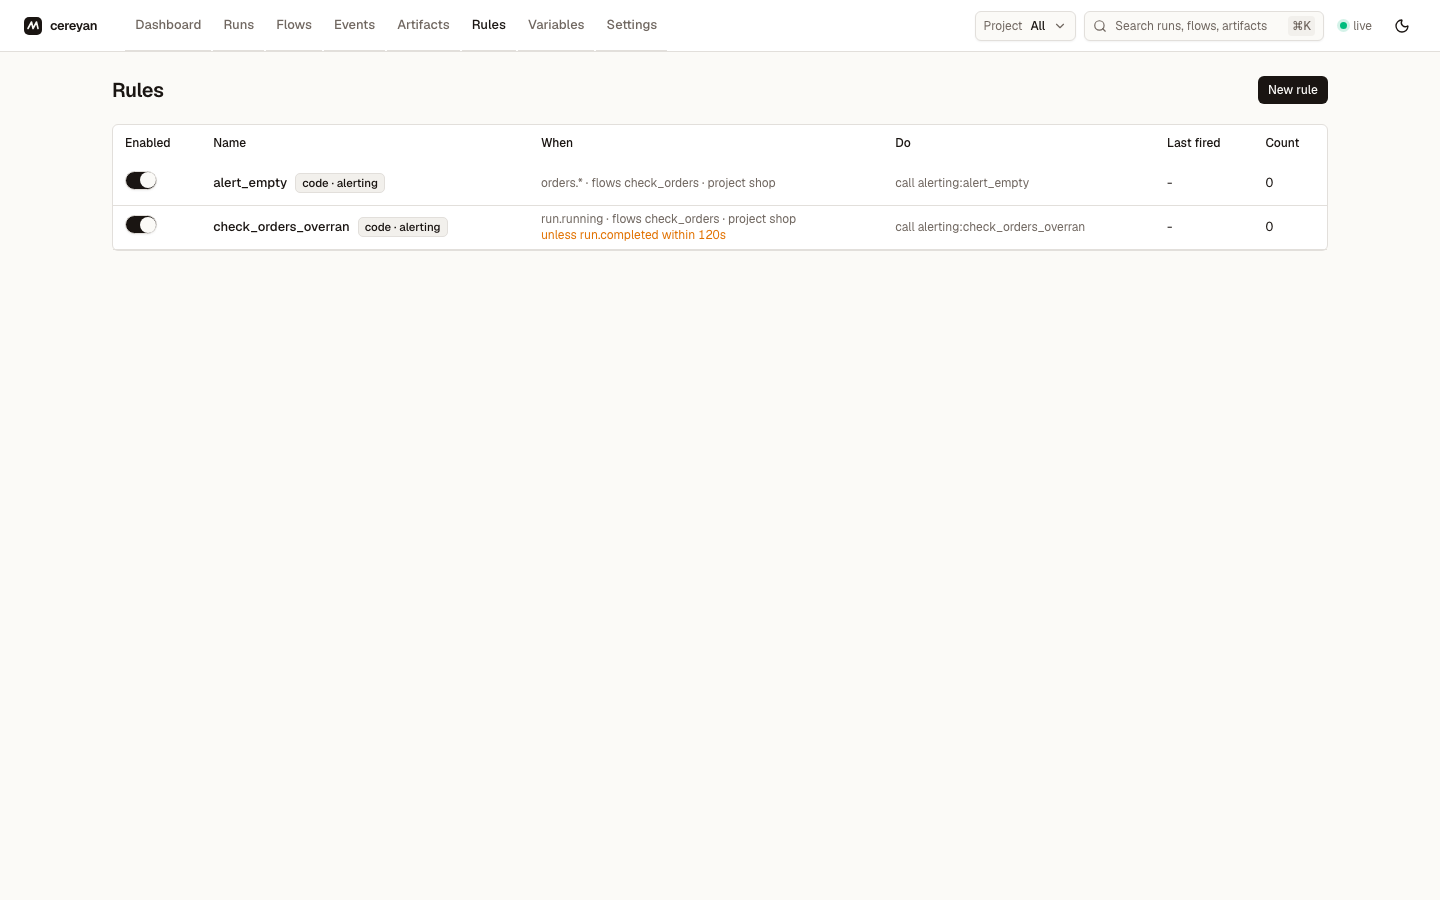
Every rule with its enabled switch, match clause, actions, last firing, and fire count. New rule opens the form: events, flows, tags, states, and project to match; the ordered actions; guards; and an Unless section for proactive rules. Code rules declared with @app.rule appear read-only with a code chip. Each rule's page lists its firings and open expectations and has a Test button that renders its templates against the most recent matching event without executing anything.
Variables
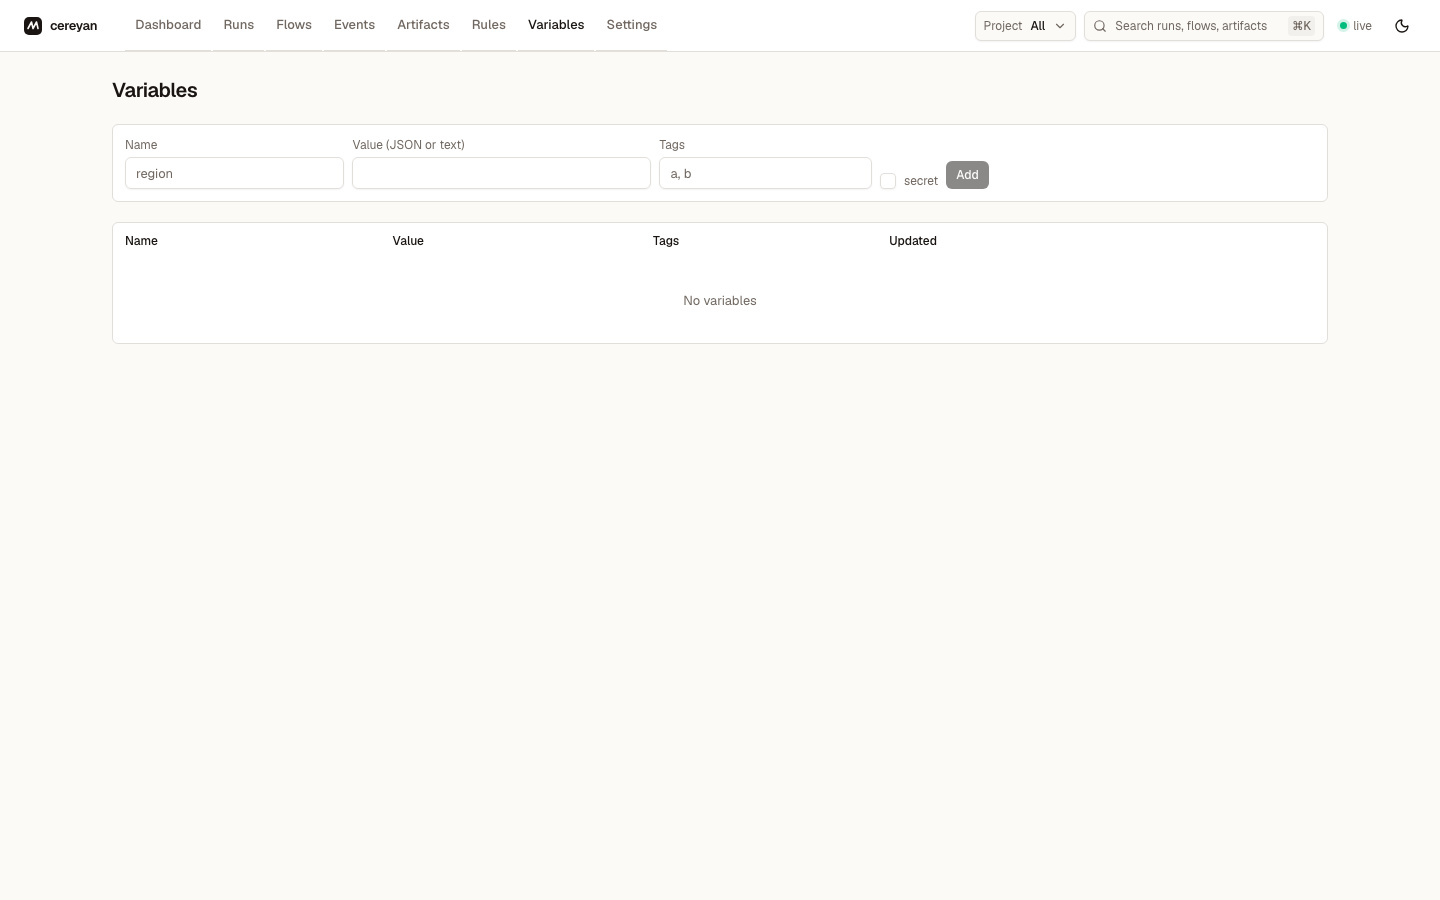
Named JSON values with tags. Secrets are stored encrypted and shown masked. Values are shared by every project on the machine.
Settings
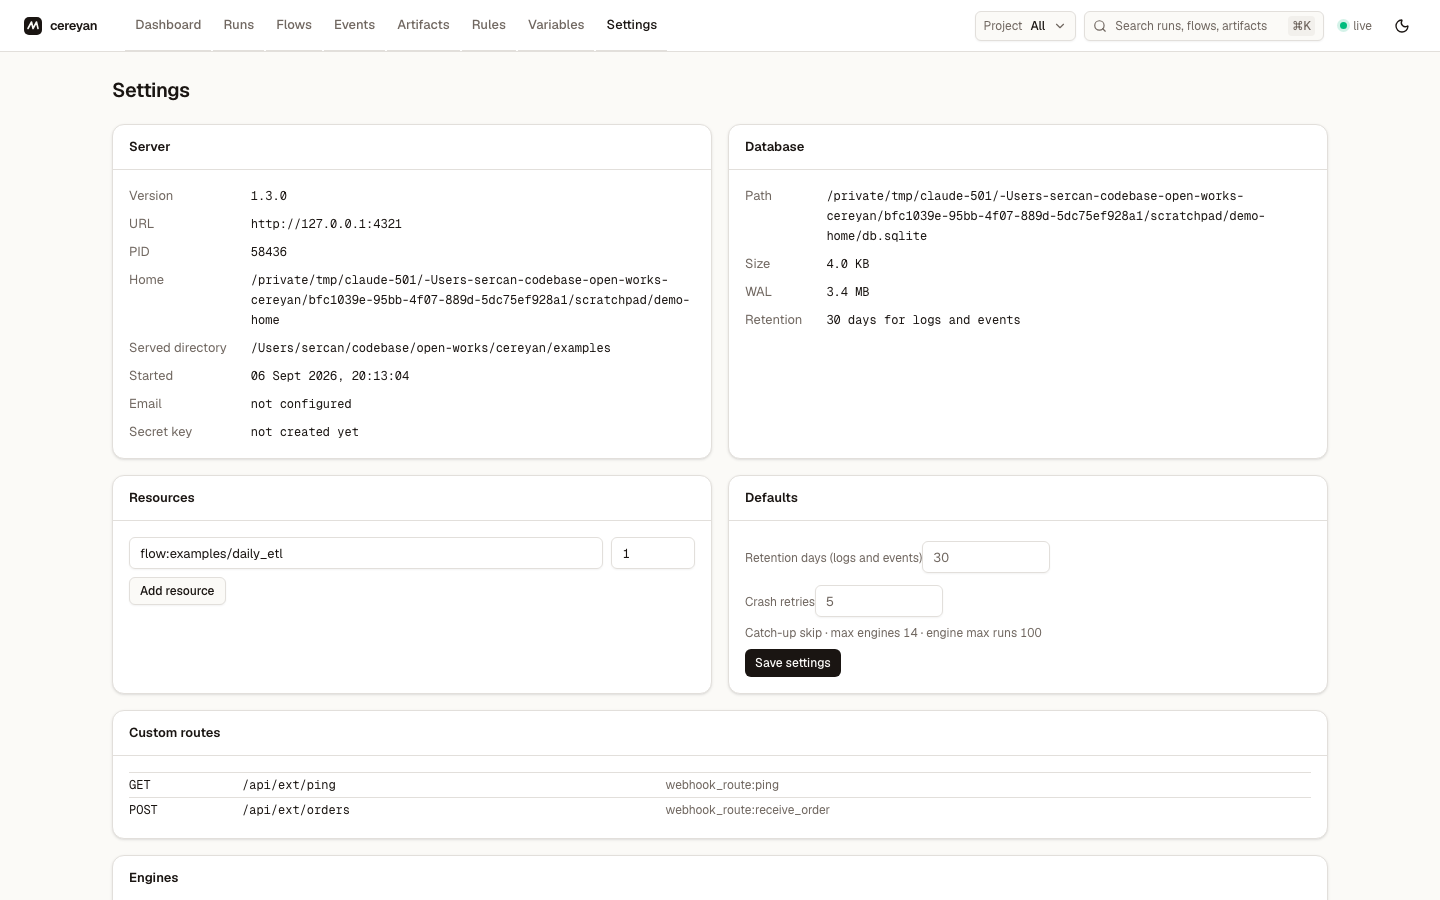
The server's version, URL, PID, home, served directory, and start time; the database path, size, WAL size, and retention; resource totals you can add and edit; the retention and crash-retry defaults; the custom routes registered by the served Apps; and the engine pool with each engine's PID, module, runs done, and current run. Saving settings writes them back to cereyan.toml.